数据可视化分析模块
1 | def analyze_data_plot(x, y): |
数据可视化模块调用代码示例
1 | if __name__ == "__main__": |
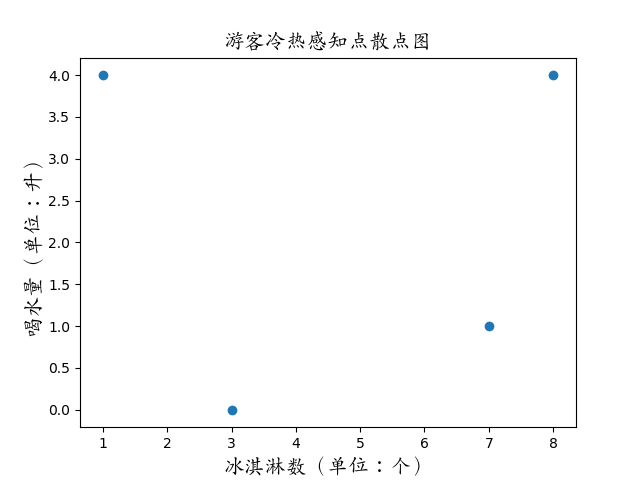
数据可视化效果展示

1 | def analyze_data_plot(x, y): |
1 | if __name__ == "__main__": |
jsonContent:
  meta: false
  pages: false
  posts:
    title: true
    date: true
    path: true
    text: false
    raw: false
    content: false
    slug: false
    updated: false
    comments: false
    link: false
    permalink: false
    excerpt: false
    categories: true
    tags: true